Non-intrusive Inject OpenTelemetry Auto-Instrumentation in Kubernetes

Background
OpenTelemetry Probe

OpenTelemetry (abbreviated as Otel, the latest version is 1.27) is an open-source project for observability, providing a set of tools, APIs, and SDKs for collecting, processing, and exporting telemetry data (such as metrics, logs, and trace information). The collection of application telemetry data (such as tracing, metrics, and logs) is done through probes, which are usually integrated into the application in the form of libraries, automatically capturing important information to assist in monitoring and debugging. OpenTelemetry probes support most programming languages on the market, and the installation of probes (commonly referred to as instrumentation) is divided into manual and automatic methods.
- Manual Instrumentation: Refers to developers directly adding telemetry data collection code in their application code, which requires manual completion of SDK initialization, insertion of tracking points, addition of context information and a series of operations.
- Automatic Instrumentation: Using the library provided by OpenTelemetry to automatically capture the telemetry data of the application, no or only a small amount of code changes are required. For example, Java implements automatic installation of probes through
javaagent.
Both have their advantages and disadvantages: Manual instrumentation is suitable for scenarios that require highly customized and precise control of telemetry data collection; automatic instrumentation is suitable for quick start-up and simplified integration, especially in applications using standard frameworks and libraries.
Introduction to OpenTelemetry Operator
OpenTelemetry Operator is a Kubernetes Operator designed to simplify the deployment and management of OpenTelemetry components in a Kubernetes environment.
The OpenTelemetry Operator implements automatic deployment and management of the OpenTelemetry Collector in Kubernetes clusters through CRD (OpenTelemetryCollector, Instrumentation, OpAMPBridge); it also automatically installs OpenTelemetry probes in workloads.
Today we will experience how to use OpenTelemetry Operator to automatically install probes and achieve link tracking.
Demonstration
Architecture
This is a demonstration architecture, Otel provides instrumentation SDKs in multiple languages, in this article we will use applications in Java and Go. These two languages will use fully automatic and semi-automatic injection installation.
- Java fully automatic injection installation, Otel Operator introduces sdk through the use of init container, and specifies
javaagentthroughJAVA_TOOL_OPTIONSfor instrumentation. Here, thepinakispecial/spring-boot-restimage will be used to run a simple Spring Boot REST service. - Go semi-automatic injection installation, why is it semi-automatic? Go’s fully automatic is implemented through the eBPF method: injecting independent containers into the Pod, loading the BPF program. However, the implementation of eBPF is very demanding on the kernel 5.4–5.14. Here demonstrates the semi-automatic method: manually introduce Go instrumentation SDK, automatic injection configuration.

Jaeger
For the sake of demonstration, we use the jaegertracing/all-in-one image to deploy Jaeger here. This image includes components such as the Jaeger collector, memory storage, query service, and UI, making it very suitable for development and testing.
Enable support for OTLP (OpenTelemetry Protocol) through the environment variable COLLECTOR_OTLP_ENABLED.
kubectl apply -f - <<EOF
apiVersion: apps/v1
kind: Deployment
metadata:
  name: jaeger
spec:
  replicas: 1
  selector:
    matchLabels:
      app: jaeger
  template:
    metadata:
      labels:
        app: jaeger
    spec:
      containers:
      - name: jaeger
        image: jaegertracing/all-in-one:latest
        env:
        - name: COLLECTOR_OTLP_ENABLED
          value: "true"
        ports:
        - containerPort: 16686
        - containerPort: 14268
---
apiVersion: v1
kind: Service
metadata:
  name: jaeger
spec:
  selector:
    app: jaeger
  type: ClusterIP
  ports:
    - name: ui
      port: 16686
      targetPort: 16686
    - name: collector
      port: 14268
      targetPort: 14268
    - name: http
      protocol: TCP
      port: 4318
      targetPort: 4318
    - name: grpc
      protocol: TCP
      port: 4317
      targetPort: 4317
EOF
Install cert-manager
The Otel Operator relies on cert-manager for certificate management, and cert-manager needs to be installed before installing the operator.
kubectl apply -f https://github.com/cert-manager/cert-manager/releases/download/v1.13.2/cert-manager.yamlInstall OpenTelemetry Operator
Execute the following command to install Otel Operator.
kubectl apply -f https://github.com/open-telemetry/opentelemetry-operator/releases/latest/download/opentelemetry-operator.yamlConfigure OpenTelemetry Collector
By creating a CR OpenTelemetryCollector to configure the Otel collector, we have configured:
otelreceiver: supports grpc (port4317) and http (port4318)memory_limiterandbatchprocessors, but for the convenience of quickly viewing data, these two are not enabled, only for display.debugandotlp/jaegerexporters, used for printing information in standard output and outputting to Jaeger using otlp protocol.pipelineservice, used to configure the processing flow of trace data: reception, processing, and output.
kubectl apply -f - <<EOF
apiVersion: opentelemetry.io/v1alpha1
kind: OpenTelemetryCollector
metadata:
  name: otel
spec:
  config: |
    receivers:
      otlp:
        protocols:
          grpc:
          http:
    processors:
      memory_limiter:
        check_interval: 1s
        limit_percentage: 75
        spike_limit_percentage: 15
      batch:
        send_batch_size: 10000
        timeout: 10s
exporters:
debug:
otlp/jaeger:
endpoint: "jaeger.default:4317"
tls:
insecure: trueservice:
pipelines:
traces:
receivers: [otlp]
processors: []
exporters: [debug,otlp/jaeger]
EOF
After creating the CR OpenTelemetryCollector, the Otel Operator will create a deployment and multiple services.
kubectl get deployment,service -l app.kubernetes.io/component=opentelemetry-collector
NAME                             READY   UP-TO-DATE   AVAILABLE   AGE
deployment.apps/otel-collector   1/1     1            1           12h
NAME TYPE CLUSTER-IP EXTERNAL-IP PORT(S) AGE
service/otel-collector ClusterIP 10.43.152.81 <none> 4317/TCP,4318/TCP,8889/TCP,9411/TCP 12h
service/otel-collector-headless ClusterIP None <none> 4317/TCP,4318/TCP,8889/TCP,9411/TCP 12h
service/otel-collector-monitoring ClusterIP 10.43.115.103 <none> 8888/TCP 12hThe four deployment models of Collector: Deployment, DaemonSet, StatefulSet, Sidecar, default is Deployment.
Configure Instrumentation
Instrumentation is another CRD of Otel Operator, used for automatic installation of Otel probes and configuration.
propagatorsare used to configure the way tracing information is passed in the context.samplersamplerenvand[language].envare added to the environment variables of the container.
For more configuration instructions, please refer to the Instrumentation API Documentation.
kubectl apply -f - <<EOF
apiVersion: opentelemetry.io/v1alpha1
kind: Instrumentation
metadata:
  name: instrumentation-sample
spec:
  propagators:
    - tracecontext
    - baggage
    - b3
  sampler:
    type: parentbased_traceidratio
    argument: "1"
  env:
    - name: OTEL_EXPORTER_OTLP_ENDPOINT
      value: otel-collector.default:4318
  java:
    env:
      - name: OTEL_EXPORTER_OTLP_ENDPOINT
        value: http://otel-collector.default:4317
EOF
Java Sample Application
Add the annotation instrumentation.opentelemetry.io/inject-java: "true" to the Pod to notify the Otel Operator of the type of application in order to inject the correct probe.
kubectl apply -f - <<EOF
apiVersion: apps/v1
kind: Deployment
metadata:
name: java-sample
spec:
replicas: 1
selector:
matchLabels:
app: java-sample
template:
metadata:
labels:
app: java-sample
annotations:
instrumentation.opentelemetry.io/inject-java: "true"
spec:
containers:
- name: java-sample
image: pinakispecial/spring-boot-rest
ports:
- containerPort: 8080
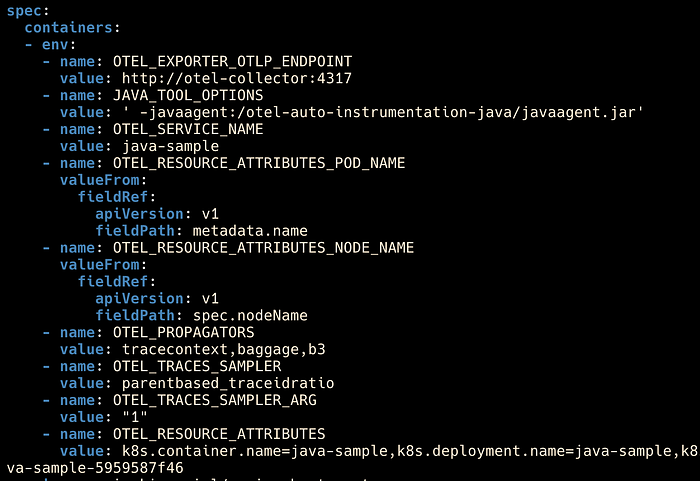
EOFIt can be seen that the Otel Operator injects an otel initialization container into the Pod.

And a series of environment variables are injected into the Java container for configuration.
Go sample application
The previous mention of the automatic injection demonstration of the Go language uses a semi-automatic method, which is inconsistent with the title of this article and belongs to the embedded. I wrote a simple Go application, using a manual method to install the Otel probe, those interested can check the source code.
kubectl apply -f https://raw.githubusercontent.com/addozhang/http-sample/main/manifests/service-v1.yamlYou can also view the Otel configuration injected through environment variables by checking the Pod.
Test
pod_name="$(kubectl get pod -n default -l app=service-a -o jsonpath='{.items[0].metadata.name}')"
kubectl port-forward $pod_name 8080:8080 &
curl localhost:8080
service-a(version: v1, ip: 10.42.0.68, hostname: service-a-5bf98748f5-l9pjw) -> service-b(version: v1, ip: 10.42.0.70, hostname: service-b-676c56fb98-rjbwv) -> service-c(version: v1, ip: 10.42.0.69, hostname: service-c-79985dc75d-bh68k)Open Jaeger UI.
jaeger_pod="$(kubectl get pod -l app=jaeger -o jsonpath='{.items[0].metadata.name}')"
kubectl port-forward $jaeger_pod 16686:16686 &
Bingo!
You can see the link information of this visit on the Jaeger UI.