OpenTelemetry Dynamic Discovery Based on Kubernetes Annotations: Building a Self-Service Observability Solution

Background
In the cloud-native era, Kubernetes has become the de facto standard for container orchestration, with more and more enterprises adopting it as core infrastructure to run and manage modern applications. However, with the widespread adoption of microservices architectures and the increasing dynamism of containerized workloads, traditional monitoring and observability tools are gradually revealing their limitations — static configurations struggle to cope with rapidly changing environments, and the cost of manually maintaining monitoring rules is becoming increasingly high.

Traditional monitoring methods typically rely on centralized configuration management, where administrators predefine the targets and services to be monitored. This approach not only lacks flexibility but also risks delayed configuration updates that fail to reflect the actual state of the cluster in a timely manner, while also introducing the possibility of errors. This challenge persists even within the open standards-based observability framework OpenTelemetry.
However, OpenTelemetry addresses this issue through its Receiver Creator and Kubernetes Observer features, enabling annotation-based dynamic discovery for the OpenTelemetry Collector.
How It Works
- Kubernetes Observer: Detects Pods and their metadata (such as exposed ports and annotations). In addition to supporting the Kubernetes API, the Observer also supports Docker API (1.24+), ECS API, ECS Tasks metadata endpoints, and Host.
- Receiver Creator: Dynamically instantiates appropriate receivers (e.g., file log receivers) based on this information. The Receiver Creator can support the creation of log, metrics, and trace receivers.

This functionality significantly simplifies the complexity of observability management by delegating control over monitoring configurations to developers.
Administrators can preconfigure Observer and Receiver Creator, defining default receiver templates. Developers simply need to add corresponding annotations to the Pod of their workloads to enable automated monitoring. Whether enabling specific receivers or customizing log parsing rules, all can be achieved through simple annotations without modifying global configurations or restarting the Collector instance.
Advantages of this solution:
- Self-service: Users can configure monitoring for their own workloads without relying on administrators.
- Dynamic Updates: Changes take effect immediately without restarting the Collector.
- Flexibility: Supports both metrics and log collection, allowing for customized configurations.
Next, we will demonstrate how to use annotation-based dynamic discovery in the OpenTelemetry Collector to implement log collection and retrieval.
Demonstration
Environment
- K3s v1.28.13+k3s1
- Loki v3.3.2
- Grafana 11.5.1
- OpenTelemetry Collector v0.119.0
1. Installing Loki and Grafana
Install Loki using Helm with the following configuration:
helm repo add grafana https://grafana.github.io/helm-charts
helm repo update
helm install loki grafana/loki \
--namespace loki \
--create-namespace \
-f values.yaml#values.yaml
loki:
auth_enabled: false
commonConfig:
replication_factor: 1
useTestSchema: true
storage:
type: filesystem
deploymentMode: SingleBinary
singleBinary:
replicas: 1
# Zero out replica counts of other deployment modes
backend:
replicas: 0
read:
replicas: 0
write:
replicas: 0ingester:
replicas: 0
querier:
replicas: 0
queryFrontend:
replicas: 0
queryScheduler:
replicas: 0
distributor:
replicas: 0
compactor:
replicas: 0
indexGateway:
replicas: 0
bloomCompactor:
replicas: 0
bloomGateway:
replicas: 0Install Grafana.
helm install grafana grafana/grafanaAccess Grafana via port forwarding at http://localhost:3000 (the Helm installation output provides the username and password).
POD_NAME="$(kubectl get pod -l app.kubernetes.io/name=grafana -o jsonpath='{.items[0].metadata.name}')"
kubectl --namespace default port-forward $POD_NAME 3000
Configure the Loki data source in Grafana, pointing to the deployed Loki instance.

2. Deploying OpenTelemetry Collector
Unlike last time, we will deploy using Helm and make necessary adjustments:
- Set the deployment mode to DaemonSet since the Otel Collector needs to run on each node to collect Pod logs.
- Specify the ServiceAccount used by the Otel Collector and assign permissions. The Kubernetes Observer requires access to the Kubernetes API, so appropriate permissions are necessary.
- Provide the Otel Collector’s configuration: configure receiver_creator (receiver), k8s_observer (extension), and otlphttp/loki (exporter).
In addition to using the default filelog receiver template, another template is provided in the configuration. This template collects logs from containers named busybox, with log paths set to /var/log/pods/namespace_pod_uid_container_name/*.log. It also adds a field named attributes.log.template with a value of busybox.
config:
  receivers:
    receiver_creator:
      watch_observers: [k8s_observer]
      discovery:
        enabled: true
      receivers:
        filelog/busybox:
          rule: type == "pod.container" && container_name == "busybox"
          config:
            include:
              - /var/log/pods/`pod.namespace`_`pod.name`_`pod.uid`/`container_name`/*.log
            include_file_name: false
            include_file_path: true
            operators:
              - id: container-parser
                type: container
              - type: add
                field: attributes.log.template
                value: busybox
The final Helm configuration is as follows.
#values.yaml
serviceAccount:
  create: false
  name: otelcontribcol
presets:
kubernetesAttributes:
enabled: true
mode: daemonset
image:
repository: otel/opentelemetry-collector-contrib
tag: 0.119.0
config:
receivers:
receiver_creator:
watch_observers: [k8s_observer]
discovery:
enabled: true
receivers:
filelog/busybox:
rule: type == "pod.container" && container_name == "busybox"
config:
include:
- /var/log/pods/`pod.namespace`_`pod.name`_`pod.uid`/`container_name`/*.log
include_file_name: false
include_file_path: true
operators:
- id: container-parser
type: container
- type: add
field: attributes.log.template
value: busybox
extensions:
health_check: {}
k8s_observer:
auth_type: serviceAccount
node: ${env:K8S_NODE_NAME}
observe_pods: true
observe_nodes: true
observe_services: true
observe_ingresses: true
exporters:
debug:
verbosity: basic
otlphttp/loki:
endpoint: "http://loki.loki:3100/otlp"
tls:
insecure: true
service:
pipelines:
logs:
receivers: [receiver_creator]
exporters: [debug, otlphttp/loki]
extensions: [health_check, k8s_observer]extraVolumes:
- name: varlog
hostPath:
path: /var/log/pods
extraVolumeMounts:
- name: varlog
mountPath: /var/log/pods
securityContext:
privileged: true
Deploy the OpenTelemetry Collector using the above configuration.
helm repo add open-telemetry https://open-telemetry.github.io/opentelemetry-helm-charts
helm repo update
helm install otel-collector-filelog open-telemetry/opentelemetry-collector \
--namespace otel-collector \
--create-namespace \
-f values.yaml3. Deploying Sample Applications
We deploy two applications in the default namespace: one is a Java application, and the other is a busybox application.
The Java application includes the annotation io.opentelemetry.discovery.logs/enabled: 'true' to enable automatic discovery and uses the default template for log collection. The busybox application does not include any annotations.
The Java application starts a web service listening on port 8080:
kubectl apply -n default -f - <<EOF
apiVersion: apps/v1
kind: Deployment
metadata:
  name: java-sample
spec:
  replicas: 1
  selector:
    matchLabels:
      app: java-sample
  template:
    metadata:
      labels:
        app: java-sample
      annotations:
        io.opentelemetry.discovery.logs/enabled: 'true'
    spec:
      containers:
      - name: java-sample
        image: addozhang/spring-boot-rest
        imagePullPolicy: Always
        ports:
        - containerPort: 8080
EOF
The busybox application starts a container that continuously outputs “hello”:
kubectl apply -n default -f - <<EOF
apiVersion: v1
kind: Pod
metadata:
  labels:
    run: busybox
  name: busybox
spec:
  containers:
  - args:
    - sh
    - -c
    - while true; do echo "hello"; sleep 1; done
    image: busybox
    name: busybox
    resources: {}
  restartPolicy: Never
EOF
By monitoring the logs of the OpenTelemetry Collector, it can be observed that the Kubernetes Observer discovered the Pod and dynamically created a FileLog Receiver.
2025-02-15T14:05:16.688Z info receivercreator@v0.119.0/observerhandler.go:127 stopping receiver {"kind": "receiver", "name": "receiver_creator", "data_type": "logs", "receiver": {}, "endpoint_id": "k8s_observer/32214501-1871-425d-b464-6008ca7e3e22/java-sample"}
2025-02-15T14:05:40.690Z info receivercreator@v0.119.0/observerhandler.go:201 starting receiver {"kind": "receiver", "name": "receiver_creator", "data_type": "logs", "name": "filelog/e6c5ca2a-6c3f-4ae4-89a6-34ca5cd9a3fa_java-sample", "endpoint": "10.42.0.142", "endpoint_id": "k8s_observer/e6c5ca2a-6c3f-4ae4-89a6-34ca5cd9a3fa/java-sample", "config": {"include":["/var/log/pods/default_java-sample-77b6d8f9c5-5zzh5_e6c5ca2a-6c3f-4ae4-89a6-34ca5cd9a3fa/java-sample/*.log"],"include_file_name":false,"include_file_path":true,"operators":[{"id":"container-parser","type":"container"}]}}
2025-02-15T14:05:40.691Z info adapter/receiver.go:41 Starting stanza receiver {"kind": "receiver", "name": "receiver_creator", "data_type": "logs", "name": "filelog/e6c5ca2a-6c3f-4ae4-89a6-34ca5cd9a3fa_java-sample/receiver_creator{endpoint=\"10.42.0.142\"}/k8s_observer/e6c5ca2a-6c3f-4ae4-89a6-34ca5cd9a3fa/java-sample"}
2025-02-15T14:05:40.893Z info fileconsumer/file.go:265 Started watching file {"kind": "receiver", "name": "receiver_creator", "data_type": "logs", "name": "filelog/e6c5ca2a-6c3f-4ae4-89a6-34ca5cd9a3fa_java-sample/receiver_creator{endpoint=\"10.42.0.142\"}/k8s_observer/e6c5ca2a-6c3f-4ae4-89a6-34ca5cd9a3fa/java-sample", "component": "fileconsumer", "path": "/var/log/pods/default_java-sample-77b6d8f9c5-5zzh5_e6c5ca2a-6c3f-4ae4-89a6-34ca5cd9a3fa/java-sample/0.log"}
2025-02-15T14:05:46.689Z info receivercreator@v0.119.0/observerhandler.go:201 starting receiver {"kind": "receiver", "name": "receiver_creator", "data_type": "logs", "name": "filelog/busybox", "endpoint": "10.42.0.143", "endpoint_id": "k8s_observer/815adda3-c0de-43a0-be25-75d8e14c5b0c/busybox", "config": {"include":["/var/log/pods/`pod.namespace`_`pod.name`_`pod.uid`/`container_name`/*.log"],"include_file_name":false,"include_file_path":true,"operators":[{"id":"container-parser","type":"container"},{"field":"attributes.log.template","type":"add","value":"busybox"}]}}
2025-02-15T14:05:46.691Z info adapter/receiver.go:41 Starting stanza receiver {"kind": "receiver", "name": "receiver_creator", "data_type": "logs", "name": "filelog/busybox/receiver_creator{endpoint=\"10.42.0.143\"}/k8s_observer/815adda3-c0de-43a0-be25-75d8e14c5b0c/busybox"}
2025-02-15T14:05:46.892Z info fileconsumer/file.go:265 Started watching file {"kind": "receiver", "name": "receiver_creator", "data_type": "logs", "name": "filelog/busybox/receiver_creator{endpoint=\"10.42.0.143\"}/k8s_observer/815adda3-c0de-43a0-be25-75d8e14c5b0c/busybox", "component": "fileconsumer", "path": "/var/log/pods/default_busybox_815adda3-c0de-43a0-be25-75d8e14c5b0c/busybox/0.log"}
4. Verification
Access the Java application via port-forward to trigger log output.
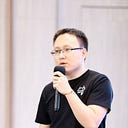
In Grafana, you can search for logs from both containers. In the logs of the busybox container, you can see the attribute log_template: busybox added by the custom template.

In the logs of the Java application, you can see the attributes applied by the default template.

Summary
This article delves into how to leverage the annotation-based dynamic discovery feature of the OpenTelemetry Collector to achieve efficient and flexible log collection and monitoring in a cloud-native environment. By combining Kubernetes Observer and Receiver Creator, administrators can preconfigure general monitoring rules, while developers can enable monitoring or log collection for their workloads simply by adding annotations. This approach not only significantly reduces the complexity of configuration management but also achieves true “self-service” observability.