Quick Exploration of Tetragon — A Security Observability and Execution Tool Based on eBPF

Tetragon is a versatile security observability and runtime policy enforcement tool that employs eBPF to apply policies and filtering directly. This approach reduces the overhead associated with monitoring, process tracking, and real-time policy enforcement.
Tetragon offers the following features:
- Process execution monitoring
- File operation monitoring
- Network activity monitoring
- Policy enforcement
The last one focuses on reacting to critical security events by sending signals or overriding system call return values. The first three emphasize monitoring, enabling association of monitoring data with container and Kubernetes metadata.

Demonstration
Environment
- Operating System: Ubuntu 20.04
- Kernel: 5.15.122
- K8s Cluster: k3s v1.27.1+k3s1
Cluster Creation
export INSTALL_K3S_VERSION=v1.27.1+k3s1
curl -sfL https://get.k3s.io | sh -s - --disable traefik --disable local-storage --disable metrics-server --disable servicelb --write-kubeconfig-mode 644 --write-kubeconfig ~/.kube/config
Deploying Sample Application
The sample application is from the “Star Wars” scenario used in Enhancing Kubernetes Network Security with Cilium.
kubectl create -f https://raw.githubusercontent.com/cilium/cilium/v1.15.0-pre.1/examples/minikube/http-sw-app.yamlInstalling Tetragon
Install Tetragon using Helm.
helm repo add cilium https://helm.cilium.io
helm repo update
helm install tetragon cilium/tetragon -n kube-system
Viewing Tetragon components.
kubectl get pod -n kube-system -l app.kubernetes.io/instance=tetragon
NAME                                READY   STATUS    RESTARTS   AGE
tetragon-operator-f68fdfcf6-jltn2   1/1     Running   0          6m23s
tetragon-mh8fp                      2/2     Running   0          6m23s
Tetragon, as a Daemonset, runs an instance on each node. We’ll use it to gather event information in the demonstration.
This command links the Tetragon daemon server with the tetra CLI in the pod to print and filter events.
-ooptions arejsonfor detailed information andcompactfor concise information.--podsprints events of specified pods, supporting regex.
kubectl exec -ti -n kube-system ds/tetragon -c tetragon -- tetra getevents -o compact --pods xwingMonitoring Process Execution
Attempting a curl request in the xwing pod.
kubectl exec -ti xwing -- bash -c 'https://ebpf.io/applications/#tetragon'CLI event monitoring reveals the process execution.
🚀 process default/xwing /usr/bin/bash -c "curl -I https://ebpf.io/applications/#tetragon"
🚀 process default/xwing /usr/bin/curl -I https://ebpf.io/applications/#tetragon
💥 exit    default/xwing /usr/bin/curl -I https://ebpf.io/applications/#tetragon 0
For detailed event information, use -o json. This includes more process details (pid, timestamp, etc.) and Kubernetes metadata (pod, labels, container details, node, etc.).
{
  "process_exec": {
    "process": {
      "exec_id": "bWFzdGVyOjEwOTE5NTI2MzMxNDc4OTM6ODY1Njk3",
      "pid": 865697,
      "uid": 0,
      "cwd": "/",
      "binary": "/usr/bin/bash",
      "arguments": "-c \"curl -I https://ebpf.io/applications/#tetragon\"",
      "flags": "execve rootcwd clone",
      "start_time": "2023-11-15T21:09:01.365214693Z",
      "auid": 4294967295,
      "pod": {
        "namespace": "default",
        "name": "xwing",
        "container": {
          "id": "containerd://53d9871b8ef6acb30a918cd2edd036ef2482f3d2f50322296b846f9a964f23c6",
          "name": "spaceship",
          "image": {
            "id": "docker.io/cilium/json-mock@sha256:4abfabfc1ac49834ce79b5594719e82b518107aa97e1867c42234a5126b1e1be",
            "name": "docker.io/cilium/json-mock:latest"
          },
          "start_time": "2023-11-15T14:09:41Z",
          "pid": 39
        },
        "pod_labels": {
          "app.kubernetes.io/name": "xwing",
          "class": "xwing",
          "org": "alliance"
        },
        "workload": "xwing",
        "workload_kind": "Pod"
      },
      "docker": "53d9871b8ef6acb30a918cd2edd036e",
      "parent_exec_id": "bWFzdGVyOjEwOTE5NTI1OTA0NDY0NzM6ODY1Njg3",
      "tid": 865697
    },
    "parent": {
      "exec_id": "bWFzdGVyOjEwOTE5NTI1OTA0NDY0NzM6ODY1Njg3",
      "pid": 865687,
      "uid": 0,
      "cwd": "/run/k3s/containerd/io.containerd.runtime.v2.task/k8s.io/9a020d636a187acf021007efe3aaf2bc2ac5af8c7bcaec8cff80834e1e456c49",
      "binary": "/var/lib/rancher/k3s/data/ead6a1703a6dcb4fa71296173ee208c5b05b95a27574fe74946557324bab2582/bin/runc",
      "arguments": "--root /run/containerd/runc/k8s.io --log /run/k3s/containerd/io.containerd.runtime.v2.task/k8s.io/53d9871b8ef6acb30a918cd2edd036ef2482f3d2f50322296b846f9a964f23c6/log.json --log-format json --systemd-cgroup exec --process /tmp/runc-process2446102553 --console-socket /tmp/pty4128173919/pty.sock --detach --pid-file /run/k3s/containerd/io.containerd.runtime.v2.task/k8s.io/53d9871b8ef6acb30a918cd2edd036ef2482f3d2f50322296b846f9a964f23c6/eaef092e99f54c7c3898984db0e0c36bc8859d695c753db86e672c8db576f4d8.pid 53d9871b8ef6acb30a918cd2edd036ef2482f3d2f50322296b846f9a964f23c6",
      "flags": "execve clone",
      "start_time": "2023-11-15T21:09:01.322512873Z",
      "auid": 4294967295,
      "parent_exec_id": "bWFzdGVyOjEwNjY3Nzk1NTk0MzcxNTE6NzgyNTA4",
      "tid": 865687
    }
  },
  "node_name": "master",
  "time": "2023-11-15T21:09:01.365213793Z"
}
Monitoring Network Activity
Apply the following policy to monitor the establishment of TCP connections, excluding intra-cluster network connections by adding the container’s IP CIDR to the NotDAddr list.
10.42.0.0/16and10.43.0.0/16are the pod CIDR and service CIDR of K3s, respectively.
kubectl apply -f - <<EOF
apiVersion: cilium.io/v1alpha1
kind: TracingPolicy
metadata:
  name: "monitor-network-activity-outside-cluster"
spec:
  kprobes:
  - call: "tcp_connect"
    syscall: false
    args:
    - index: 0
      type: "sock"
    selectors:
    - matchArgs:
      - index: 0
        operator: "NotDAddr"
        values:
        - 127.0.0.1
        - 10.42.0.0/16
        - 10.43.0.0/16
      matchActions:
      - action: Sigkill
EOF
Monitored events now include the establishment of TCP connections.
🚀 process default/xwing /usr/bin/bash -c "curl -I https://ebpf.io/applications/#tetragon"
🚀 process default/xwing /usr/bin/curl -I https://ebpf.io/applications/#tetragon
🔌 connect default/xwing /usr/bin/curl tcp 10.42.0.7:38676 -> 104.198.14.52:443
💥 exit    default/xwing /usr/bin/curl -I https://ebpf.io/applications/#tetragon 0
Implementing Policies
To write-protect the /etc directory, modify the previously created file-monitoring-filtered policy by adding matchActions.
kubectl apply -f - <<EOF
apiVersion: cilium.io/v1alpha1
kind: TracingPolicy
metadata:
  name: "file-monitoring-filtered"
spec:
  kprobes:
  - call: "security_file_permission"
    syscall: false
    return: true
    args:
    - index: 0
      type: "file" # (struct file *) used for getting the path
    - index: 1
      type: "int" # 0x04 is MAY_READ, 0x02 is MAY_WRITE
    returnArg:
      index: 0
      type: "int"
    returnArgAction: "Post"
    selectors:
    - matchArgs:
      - index: 0
        operator: "Prefix"
        values:
        - "/etc"
      - index: 1
        operator: "Equal"
        values:
        - "2" # MAY_WRITE
      matchActions:
      - action: Sigkill
EOF
Attempting to modify files under /etc now results in the process exiting immediately.
kubectl exec -ti xwing -- bash -c 'echo foo >> /etc/bar'
command terminated with exit code 137
Event monitoring shows the process execution was terminated by a SIGKILL signal.
🚀 process default/xwing /usr/bin/bash -c "echo foo >> /etc/bar"
📝 write   default/xwing /usr/bin/bash /etc/bar
📝 write   default/xwing /usr/bin/bash /etc/bar
💥 exit    default/xwing /usr/bin/bash -c "echo foo >> /etc/bar" SIGKILL
Similarly, monitoring of network activity can also be implemented in this manner.
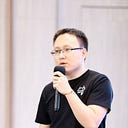
Tetragon Architecture
The architecture diagram is similar to the one previously seen in Exploring Cilium’s Working Mechanism.
The tetragon pod contains two containers: export-stdout and tetragon.
kubectl get pod tetragon-mh8fp  -o=jsonpath='{.spec.containers[*].name}' -n kube-system
export-stdout tetragon
The tetragon container runs the Tetragon Daemon process, which also allows executing the tetra command (tetragon CLI).
Daemon process:
- Loads/unloads BPF programs.
- Monitors policy changes, writing policies into eBPF Maps. In non-K8s environments, it monitors policy updates in file directories.
- Provides an external gRPC API, listening on
127.0.0.1:54321. CLI execution is essentially through this API interacting with the Daemon.
Tracing Policies
Whether monitoring or policy implementation, both are
accomplished through Tracing Policies. TracingPolicy, a custom resource of Tetragon, allows users to trace arbitrary events in the kernel and define actions to be taken for matched events.
Policies consist of hook points (supporting kprobes, tracepoint, and uprobes) and selectors for kernel filtering and specifying actions.
Hook Points
Tetragon supports three hook points: kprobes, tracepoints, and uprobes. Kprobes and tracepoints are for kernel space, while uprobes are for user space programs.
- kprobes (kernel space probes): Attach BPF code to kernel functions, like
tcp_connectused for monitoring network activity. Strongly dependent on the kernel version, meaning probes may differ across kernel versions. - tracepoints (trace points): More stable across kernel versions compared to kprobes. Use
sudo ls /sys/kernel/debug/tracing/eventsto view available trace points. - uprobes (user space probes): Set probes at specific addresses in user space programs to monitor and trace the execution of user space code. (Currently, Tetragon documentation on this part is missing).
Selectors
In Tetragon, TracingPolicy uses selectors to define kernel BPF filtering and actions for events, specifying the events of interest and actions to be triggered. Selectors include:
- Arguments
- Return values
- Process PID
- Binary file paths
- Linux namespaces
- Linux capabilities
- Namespace changes
- Capability changes
- Applying actions to selectors
For example, in the previous example, the write protection for the /etc directory used argument selectors (matching the operation directory and type) and action selectors (returning a Sigkill signal).
Conclusion
Tetragon is a tool focused on eBPF, real-time processing, security, observability, and policy enforcement, especially in Kubernetes environments. It utilizes a series of advanced hook points and selectors to provide robust support for infrastructure security and effectively protect against key events.
A deeper understanding of Tetragon reveals its primary role as a low-level tool focused on implementing security policies around processes, files, and network activities. In terms of networking, Tetragon primarily deals with Layer 3 (L3) base information events, such as IP-level communications, and is limited in handling higher-level application protocols, like Layer 4 (L4) TCP or Layer 7 (L7) application layer protocols. This limitation reflects Tetragon’s core positioning: focusing on low-level structure monitoring and security, not high-level application protocol analysis.
Overall, Tetragon offers a low-level security and monitoring tool optimized for Kubernetes environments, with strong eBPF support making it excellent in handling infrastructure security events, albeit with limitations in higher-level network protocol processing.